INTRODUCTION
This week saw a new major milestone set: July 19th. Plans to open nightclubs, ordering at bars and groups of more than 6 able to meet and eat out. Retailers have been capitalising on the ever changing 'historic date', dedicating entire website pages to 'June 21st outfits' - I wonder if they will rename these July 19th?
Since our last report, indoor seating has opened which meant no more hiding under an umbrella sheltering your pint from the downpours; however we thought it would be interesting to see if Yorkshire 'bounced back' in the wake of outdoor eating opening.
Similar to our London project, we have analysed the movement of unique mobile devices around our food and beverage (f+b) hubs across the UK; setting 2019 data as a base marker for an ‘average year’, January - April 2021 data as ‘lockdown’ and then April 12th - May 11th to gain an understanding of the impact of outdoor seating.
Our f+b hubs were all created by us, making for a very unique data set. The hubs cover locally recognised ‘destination’ eating and drinking places across cities, large towns and tourist towns and were created by determining which are on the same or adjacent streets. We then pinpointed areas of a high concentration of these establishments. The final stage was a manual review, set to categorise the type of hub and whether it is predominantly eating, drinking or clubbing.
It will be interesting to see how Yorkshire’s recovery fairs compared to London; as the UKs largest county, it is generally demarcated into 4 separate counties (for administration and geographical purposes). We have also followed suit with this demarcation, breaking our analysis down into:
- North Yorkshire – with f+b hubs in Harrogate and York
- West Yorkshire – with f+b hubs in Leeds, Bradford, Halifax, Wakefield and Huddersfield
- South Yorkshire – with f+b hubs in Sheffield
- East Ridings of Yorkshire – with f+b hubs in Hull
AN ANALYSIS OF YORKSHIRE
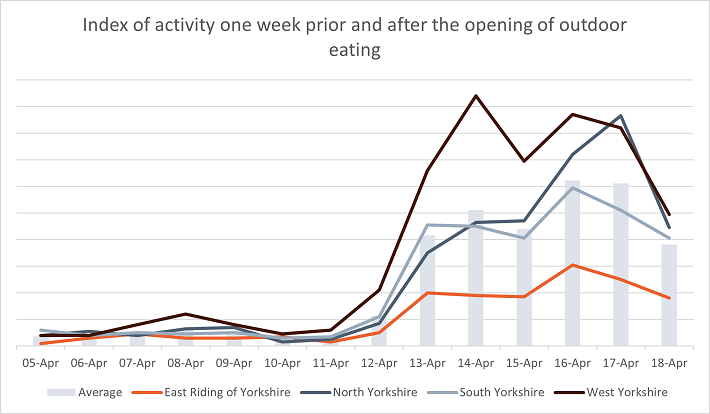
Graph 1, which looks at Activity Levels ranging from 1 week before to 1 week after the opening of outdoor seating, shows clearly that the easing of restrictions has had an impact on all 4 Yorkshire counties; West Yorkshire bounced back almost instantaneously with a peak seen on Wednesday 14th April, maintained throughout that week. North Yorkshire saw dramatic recovery of activity levels on Saturday 17th April, and both West and North Yorkshire saw activity levels above the average seen across Yorkshire in its entirety.
Whilst West and North Yorkshire saw significant increases in activity levels, South Yorkshire and East Ridings of Yorkshire sat slightly below the county average. However, both South and East Ridings saw their biggest improvements in activity levels on Friday 16th April, as opposed to Saturday 17th (North Yorkshire) and Wednesday 14th (West Yorkshire).
As with our London report, we found benefit in analysing the change in activity levels compared to both Lockdown and pre-COVID (2019). Maps 1 and 2 give a visual indication on which counties within Yorkshire have been recovering slightly better than others – akin to our London Borough Analysis.
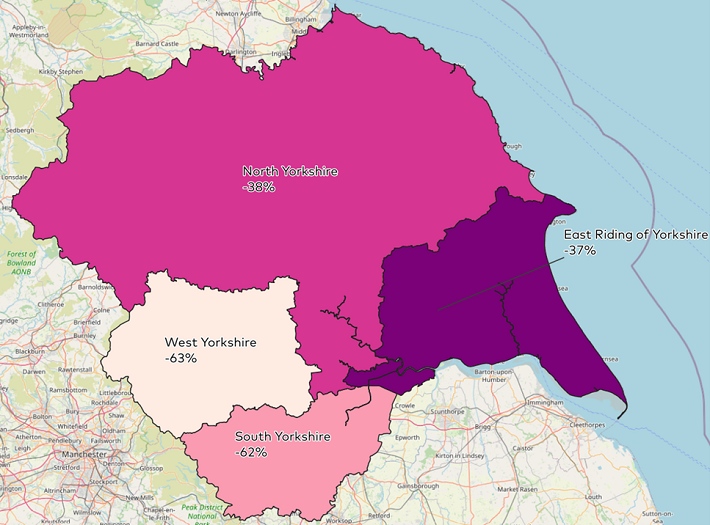
Interestingly, East Riding of Yorkshire has recovered the most successfully, only 37% below its 2019 activity levels, pipping North Yorkshire to the top spot by 1%. It is insightful to note the apparent divide in recovery (to 2019 levels) between North and East Ridings of Yorkshire, and South and West Yorkshire. Whilst the former are 37% and 38% below 2019 activity levels, the latter are still sitting 62% and 63% respectively, below their 2019 activity levels.
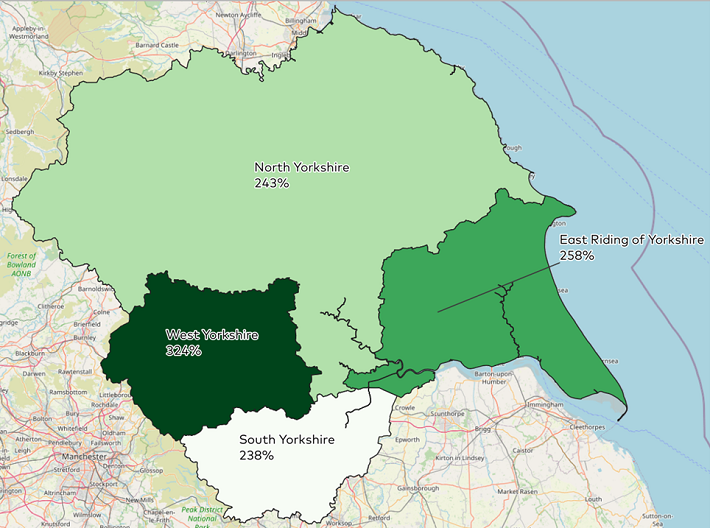
Again, as with our London report, we deemed it crucial to also analyse recovery compared to Lockdown activity levels – with restrictions and uncertainties still in place it would be surprising if a full pre-COVID recovery had been made.
Map 2 analyses just that – the recovery in comparison with Lockdown, and the results are surprising. Whilst East Ridings of Yorkshire is still recovering extremely well, seeing a 258% increase compared to Lockdown, West Yorkshire has taken the top spot, with a 324% bounce back on Lockdown levels. Again, South Yorkshire seeming to struggle to with increasing activity levels – hopefully, we see an increase now that indoor eating has fully established itself again.
AN ANALYSIS OF NORTH YORKSHIRE SPECIFIC
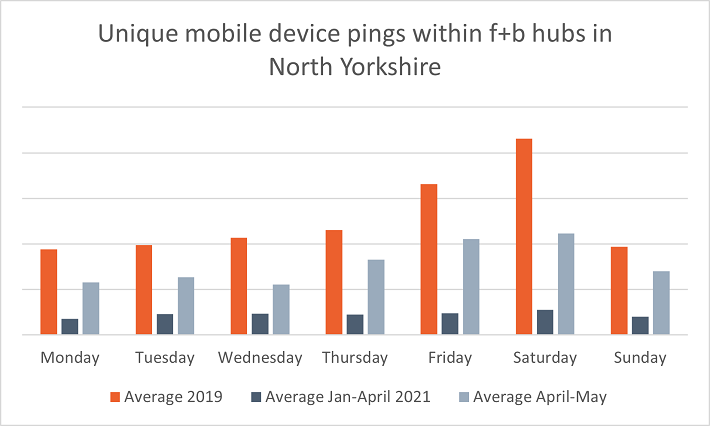
North Yorkshire, the home of York, Harrogate and Whitby – to name but a few- saw a 258% increase in activity levels compared to those experienced in Lockdown, not falling far off its 2019 activity levels either, sitting just 37% short. Graph 2, which compares the average activity levels by day of the week, indicates that Fridays and Saturdays having recovered the most compared to Lockdown levels, with an increase of 342% and 302% respectively. This is to be expected - who doesn’t love to go out for a drink at the end of the work week?
However, surprisingly, it’s Thursdays that have recovered the most in relation to pre-COVID levels, falling only 28% shy of 2019 activity levels.
These differences in recovery are made even more apparent as during Lockdown, the same number of unique mobile device pings were recorded across all seven days (apart from Saturday which saw just slightly more average activity).
AN ANALYSIS OF EAST RIDINGS OF YORKSHIRE SPECIFIC
East Ridings of Yorkshire, the home Hull and Beverly – to name but a few – saw a 258% increase in activity levels compared to those experienced in Lockdown, not falling far off its 2019 activity levels either, sitting just 38% short. Looking at Graph 3, it is as expected that Fridays and Saturdays experienced the most recovery, with an average of 375% and 373% compared to Lockdown, respectively.
However, Tuesdays are of note in East Ridings, with activity levels seen in April/May only 14% shy of pre-COVID levels – this is the best recovery in comparison to 2019 levels that the whole of Yorkshire experienced. What is going on in Hull on a Tuesday?
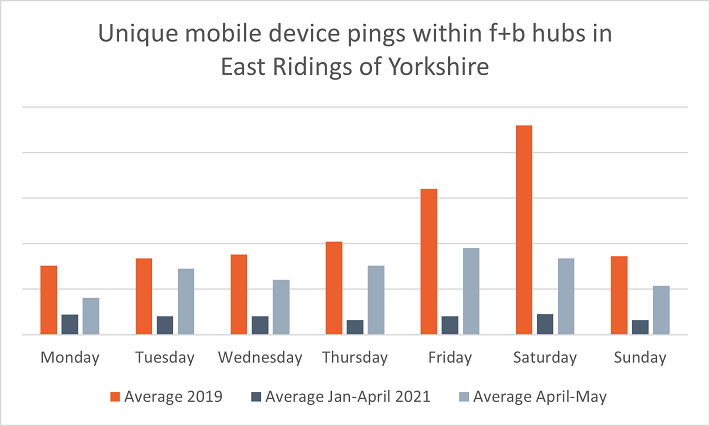
When looking at Graph 1 it must be remembered that activity levels in East Ridings of Yorkshire are lower than the other 3 counties, even pre-COVID. And so, whilst Graph 1 gives the impression that East Ridings hasn’t recovered as successfully as the other counties, that is in a comparison to them, and the Yorkshire average. However, when comparing against itself (Graph 3), it is apparent that East Ridings is recovering rather well.
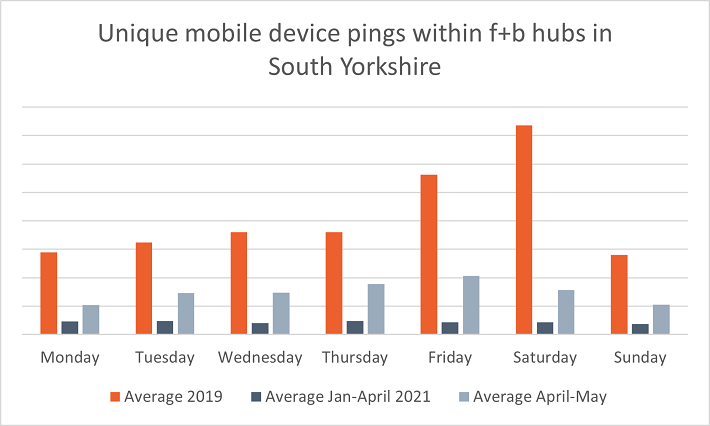
AN ANALYSIS OF SOUTH YORKSHIRE SPECIFIC
South Yorkshire, home to Sheffield and Doncaster – to name but a few – saw a 238% increase in activity levels compared to those experienced in Lockdown; this was the weakest recovery out of the 4 Yorkshire counties, and the same can be said for recovery compared to 2019 levels, with South Yorkshire 63% off its pre-COVID activity.
In relation to 2019, Thursdays have recovered the best, falling only 51% behind pre-COVID mobility levels. Similar to East ridings of Yorkshire, Tuesdays have also recovered rather well, just 55% off 2019 levels.
However, speaking to one of our team based in Sheffield, activity levels have been struggling to bounce back to what they were, and this is apparent when looking at Graph 4. Saturdays have struggled to bounce back the most, falling, on average, 79% short of pre-COVID levels. For comparison, Saturdays during Lockdown saw a 94% reduction in activity levels (compared to 2019), highlighting the true impact of the closure of non-essential venues.
In further comparison:
• North Yorkshire: Saturdays during Lockdown saw an 87% reduction in activity levels
• East Ridings of Yorkshire: Saturdays during Lockdown saw a 90% reduction in activity levels
• West Yorkshire: Saturdays during Lockdown saw a 95% reduction in activity levels
AskTraders conducted a study into declining UK high streets in 2020, and Sheffield was placed as the 10th worst high street in the UK (scoring was given by analysing the opening and closures of banks, ATMs and retail places).
{To note, both York and Leeds also placed in the Top 20 worst declining high streets in the UK (7th and 19th respectively), whilst Huddersfield, Hull and Doncaster placed 2nd, 4th and 16th (respectively) in the top-rated high streets – using same measurement.}
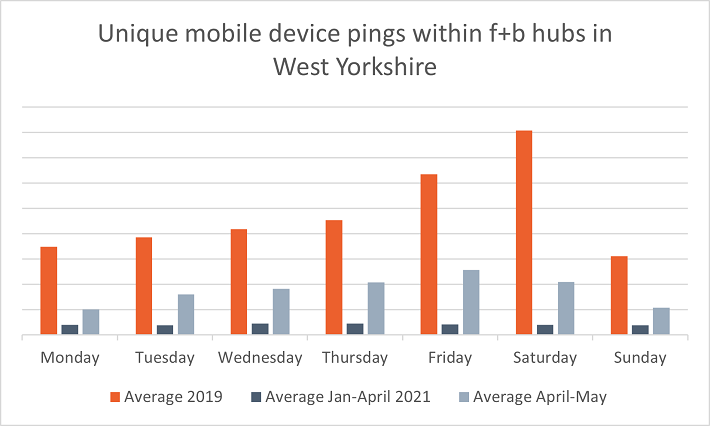
AN ANALYSIS OF WEST YORKSHIRE SPECIFIC
South Yorkshire, home to Leeds, Bradford and Wakefield – to name but a few – saw a 324% increase in activity levels compared to those experienced in Lockdown, the most significant out of all 4 of the Yorkshire counties. The same cannot be said when looking at recovery in comparison to pre-COVID, with West Yorkshire falling 63% short of its 2019 activity levels.
Akin to North and South Yorkshire, Thursdays have recovered the best, falling on 54% behind 2019 mobility levels, also seeing a 367% increase on mobility levels experienced in Lockdown. Looking at Graph 5 however, the weekends have been struggling. Whilst Fridays and Saturdays have seen an increase of 517% and 421% respectively, they are still falling 93% and 95% behind pre-COVID mobility levels. This is to be expected; Fridays and Saturdays were hugely busy in 2019, likely due to the three Universities located in Leeds boosting the lively nightlife, alongside the growing popularity of dining ventures such as bottomless brunch. Having high levels of mobility in 2019 meant they essentially had ‘further to fall’, so rather we should be focusing on the encouraging signs of recovery compared to lockdown levels.
HAS YORKSHIRE RECOVERED?
The data indicates clearly that Yorkshire is on the road to recovery, with mobility increasing in line with the lifting of restrictions on outdoor eating. Thinking back to April 12th – a historic date that will be remembered for some time – the weather was not exactly ideal for outdoor dining - although there are photos of very hardy Brits protecting their pints with umbrellas! It is therefore predicted that activity levels will continue to recover with the lifting of restrictions on indoor eating.
Having analysed the impact of outdoor seating opening, it will be interesting to see whether there has been a dramatic spike in mobility after both May 17th (indoor seating) and July 19th.
Chris Storey & Kate McGoldrick, Data Scientist and Communications Officer at Geolytix
Photo by Louis Hanselon on Unsplash